Privacy Incident Churn Rate and Revenue Loss Benchmarks
Breaches cost far more than headline figures capture through years of customer churn.
IBM's 2026 Cost of a Data Breach Report, drawn from 602 breached organizations across 16 countries between March 2025 and February 2026, puts the global average cost at the highest point in the study's 21-year history, and it climbed again from the year before. U.S. organizations came in at more than double that global number. Those figures get repeated in board decks and vendor pitches as though they settle the question of what a breach costs. They don't.
A headline average is a snapshot of what happened in the weeks after an incident got discovered. It's not a model of what keeps happening for years afterward. Privacy incidents actually create two separate financial injuries (the immediate, measurable breach cost (forensics, notification, remediation, fines) and the slower, harder-to-quantify revenue drain from customer churn and trust erosion), and most organizations only price one of them. The first is the immediate, countable cost: forensics, notification letters, remediation work, fines. The second is slower and much harder to pin down, a revenue drain that comes from customers quietly leaving and trust eroding over time, long after the incident report gets filed. Organizations close the ticket on the first injury and call the breach resolved. The second one is still running.
What the immediate breach cost is made of
Breaking the headline figure into its parts reveals a pattern fast. Whatever's left splits across notification costs, rebuilding systems, and regulatory fines.
Put detection and escalation together with lost business, and those two categories alone make up close to two-thirds of the total average cost. The customer-facing, revenue-side cost of a breach is already the dominant driver of the headline number, before anyone even starts counting the churn that follows in later quarters.
And that's the catch. The "lost business" line in IBM's model only captures the acute phase, the downtime, the customers who bail in the first few weeks, and the reputational hit that appears while the story's still in the news. It doesn't capture the churn that compounds for months or years after the incident stops being a headline. Research puts the indirect cost of that trust-driven churn at an average of $1.2 million per breach, sitting entirely outside what IBM's standard cost model tracks. The gap between what gets measured and what actually happens lets a company declare a breach closed while the revenue bleed continues, because the standard cost model does not track the ongoing churn that drains revenue after the incident is closed.
Customer churn after a breach, by segment
Customer loss after a breach isn't a vague reputational worry. It's measurable, and the industry has been measuring it for years. The average share of customers a company loses after a major breach tends to look, on its face, fairly survivable. Most organizations glance at that number, decide it's manageable, and move on. That's the wrong read.
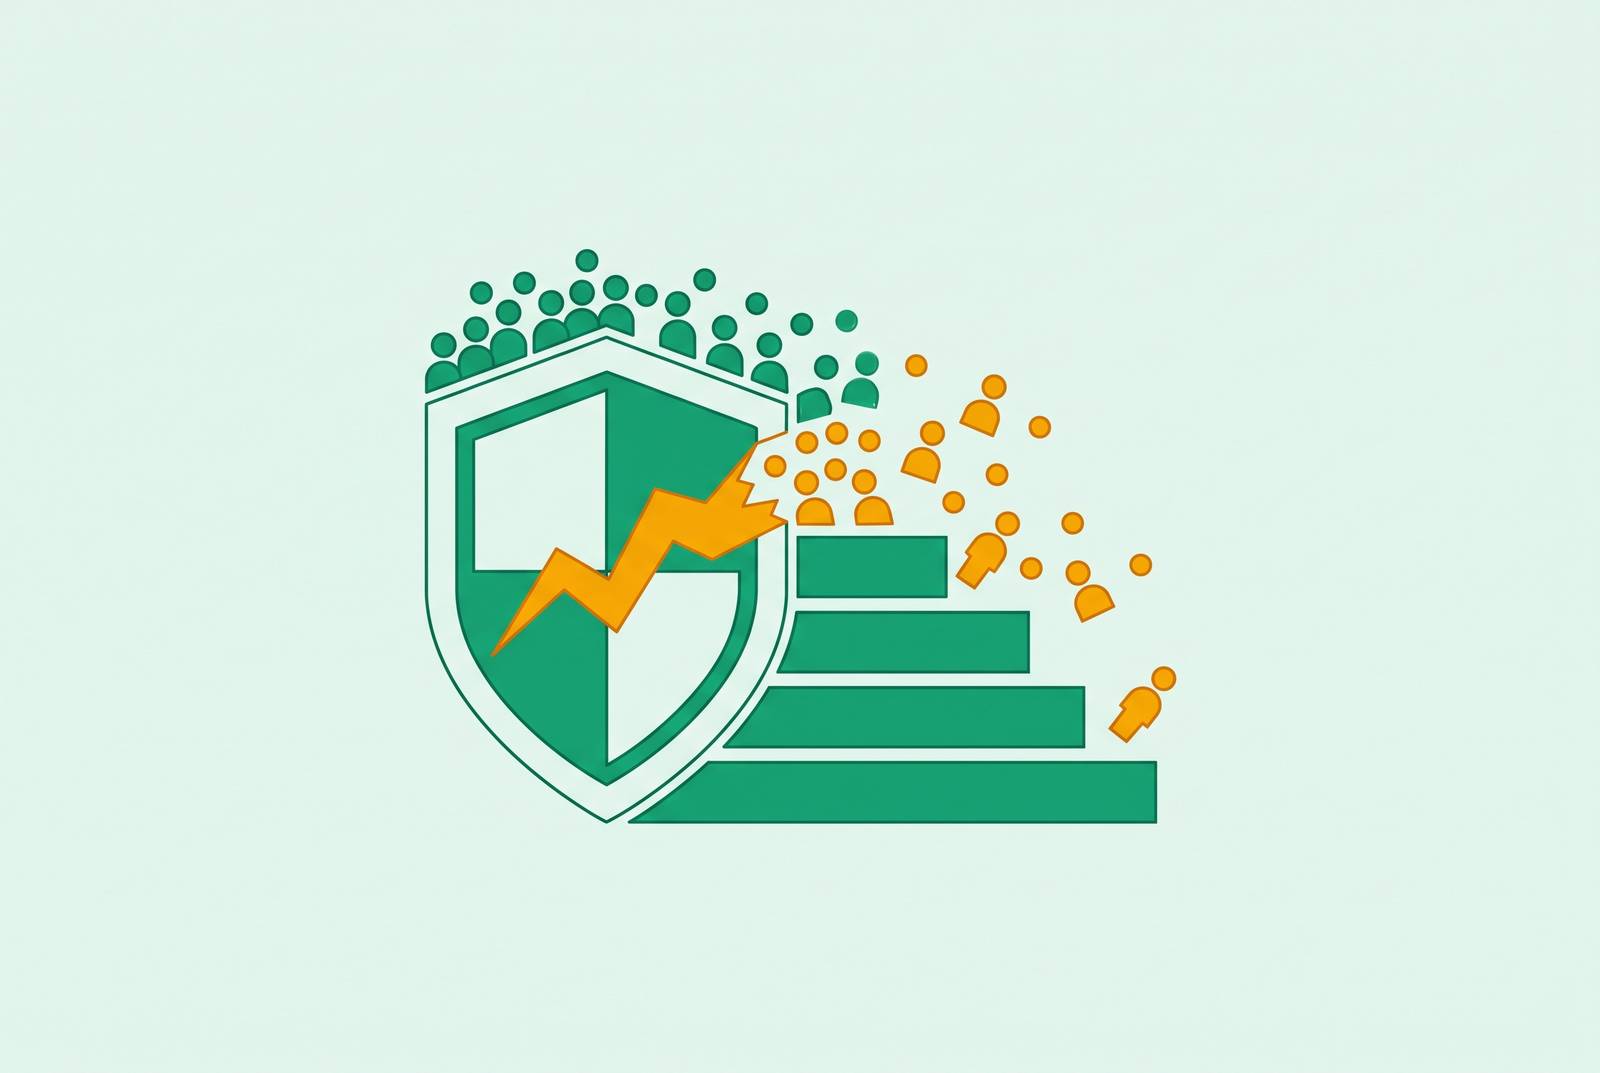
Ponemon's research found that the customers most likely to walk away after a breach are the ones with the longest tenure and the highest engagement, in other words, the customers worth the most, not how many leave overall. It's which ones. Ponemon's research found that the customers most likely to walk away after a breach are the ones with the longest tenure and the highest engagement, in other words, the customers worth the most. A breach doesn't take an even slice off the top of the customer base. It disproportionately removes the most valuable relationships a company has built.
That inversion changes the whole calculation. An "average churn rate" tells you almost nothing useful, because it treats every lost customer as financially interchangeable, and they're not. Losing an average share of customers is not the same as losing that share of customer revenue, and the gap between those two numbers is where a lot of exposure hides. The effect compounds, too: a breach that pushes up the annual churn rate doesn't just cost a company customers in year one. That elevated churn rate keeps accumulating losses across multiple fiscal years before it settles back down.
Consumer behavior backs this up directly. Separately, 65% of consumers say they lose trust in a brand immediately after a breach, and 32% say they'd permanently stop doing business with a company after their financial data got exposed. These aren't hypothetical intentions. Multiple independent surveys document these behavior patterns. Consumer intent data reinforces the behavioral pattern: per the Thales 2025 Digital Trust Index, a large majority of consumers abandoned a brand in the past year over how it handled their data, and per the Cisco 2024 Consumer Privacy Survey, 49% of 25-to-34-year-olds have switched companies or providers over their data policies or data-sharing practices.
Translating churn rates into a revenue model organizations can use
Benchmark churn figures are averages pulled across wildly different businesses, so treating any single number as a direct forecast for a specific company is a mistake. Their real value is as an input into a company's own model, not as a stand-in for it.
Take a subscription business as an example. A meaningful increase in churn rate after a breach can translate into thousands of additional customers lost per year, working out to roughly $1.9 million in annual revenue loss from churn alone. And that's before adding in what it costs to replace those customers. Acquisition cost to backfill churned customers typically runs higher than the revenue lost per customer in the churn year itself, which means the true multi-year cost is worse than the first-year number suggests.
Building a real exposure model means gathering current customer count and average revenue per customer, baseline churn rate before any incident, an industry-appropriate churn sensitivity figure, and the distribution of customer lifetime value across the base. That last input matters more than it looks. Because of the Ponemon inversion, high-LTV customers need to be modeled as their own segment, not blended into an average, or the model will understate exposure exactly where it matters most.
A leading indicator can be tracked before the churn numbers even show up. A company watching sentiment can project churn before it happens rather than discovering it in a quarterly revenue report. Transparent breach reporting has been shown to cut churn by up to 30%. That's not a communications footnote. That's a revenue variable that belongs in the model itself. Customer sentiment scores declined by 13–17 points on average after a widely publicized breach, a leading indicator that can be tracked in real time and used to project churn before the customers actually leave.
How churn sensitivity differs by industry
No single churn benchmark applies evenly across industries, because switching costs and data sensitivity vary enormously from one sector to the next. A bank customer and a retail customer respond to a breach through completely different mental math, and a model that ignores that difference will misprice exposure in both directions.
Financial services customers tend to punish breaches hard, because the data involved (account numbers, balances, credit history) feels irreplaceable and the switching costs, while real, don't outweigh the fear of staying somewhere that already failed to protect that information. Healthcare carries a similar dynamic: medical records and diagnoses feel permanently compromised once exposed, and that makes trust recovery slower even when the operational fix is fast.
Retail sits differently. Average breach costs in retail tend to run below several other sectors, and churn after a retail breach is generally described as moderate rather than severe, largely because retail loyalty is often driven by price and convenience rather than deep trust in how a company handles data. A shopper who gets a breach notice from a retailer they visit twice a year behaves nothing like a bank customer whose entire financial history just got exposed. One industry does not simply suffer more than another in some absolute sense. It's that the churn mechanism itself is different by sector, and any exposure model that borrows a single industry's churn sensitivity and applies it elsewhere will be wrong in a predictable direction.
The trust erosion that precedes churn rarely shows up in incident reports
Not every dollar of churn-related revenue loss traces back to a breach at all. A slower phenomenon accompanies the acute, breach-triggered churn, something CX Today's analysis calls silent trust erosion. Customers don't always leave in a dramatic exit right after a headline. More often, trust wears down through small, everyday moments that feel careless, confusing, or inconsistent, a cluttered consent form, a data-sharing disclosure buried in fine print, a customer service interaction that reveals a company knows more about someone than expected.
The signal appears not as a spike but as fewer logins, more opt-outs, and quieter engagement. It appears as fewer logins, more opt-outs, quieter engagement, and eventually a customer who's just gone, with no complaint filed and no explanation given. That matters because it means a company can be losing meaningful revenue to privacy practices without ever logging a formal incident. No breach report gets written. No forensics team gets called in. The loss just accumulates in the background, invisible to the standard cost-of-breach frameworks that only trigger when there's an actual event to measure.
Cisco's 2024 Consumer Privacy Survey found that a large majority of consumers won't buy from an organization they don't trust with their data, and 48% said they'd already stopped buying from a business specifically over privacy concerns. That's not breach-driven churn. That's ambient, ongoing attrition tied to how a company behaves day to day. And because it rarely triggers an incident report, it rarely makes it into the financial models companies use to justify privacy investment in the first place. Organizations that only benchmark privacy risk against discrete breach events are missing a continuous revenue leak that runs in the background between incidents, one that never appears on the incident log because there's no incident to log.
How market capitalization and stock price turn churn risk into shareholder risk
The revenue drain from churn doesn't stay contained to a company's own books. It affects the stock price almost immediately, often faster than the company itself has finished counting the damage. An event study published in Information Systems Frontiers found that firms lose an average of $309.33 million in market value on the day a cyber-attack is reported, and that hit gets worse when the news breaks through influential outlets. For a mid-cap tech company, that translates to roughly $420 million in lost market cap on disclosure day alone, and a slide that continues over the following weeks can push the total well past that.
The mechanism produces two distinct financial injuries: the immediate, measurable breach cost (forensics, notification, remediation, fines) and the slower, harder-to-quantify revenue drain from customer churn and trust erosion. Marks & Spencer's 2025 breach caused substantial lost revenue and wiped a large amount off the company's market value. F5, Inc. disclosed on October 15, 2025 that a sophisticated nation-state actor had breached its systems; the stock fell meaningfully within 30 days, and as of January 2026 it still sat well below where it traded before the disclosure. Neither case is a cautionary tale about that specific company. Both are illustrations of a structural pattern: markets price in expected future churn and revenue loss almost instantly.
Recovery isn't uniform across sectors, either. Technology companies like Sony, Apple, and T-Mobile showed more gradual stock declines after a breach but kept underperforming the NASDAQ six months out. E-commerce and social platforms like Yahoo, LinkedIn, and Facebook took sharper immediate hits but were more likely to outperform the NASDAQ within six months. Recovery trajectory depends on the sector, not on some universal bounce-back timeline. What ties all of this together is simple: the slow revenue drain from churn isn't a quiet, back-office problem that finance quietly absorbs. Analysts and investors are already pricing it into the stock, often before the company has even finished its internal accounting of the damage.
Regulatory fines as a multiplier on top of the revenue loss, not a substitute for it
None of the costs described so far include what regulators eventually charge, and that's the part boards most often get wrong: fines land on top of the revenue loss, not instead of it. Cumulative GDPR fines have grown substantially since 2018, with a particularly large tranche issued in 2025, according to the DLA Piper GDPR Fines and Data Breach Survey released in January 2026. Under GDPR, a serious breach can trigger a fine calculated as a percentage of a company's total worldwide annual revenue or a fixed ceiling, whichever number is higher, and that penalty gets calculated entirely separately from whatever revenue the company already lost to churn.
Litigation adds another layer. Privacy-related lawsuits increased materially in 2025 compared with the year before, which means a company can consider an incident operationally resolved while a legal-cost tail keeps growing behind it. And disclosure itself has become a recurring event rather than a one-time announcement: the SEC's 2023 cybersecurity disclosure rule has produced a steady stream of Form 8-K filings, each one typically followed by stock-price movement shortly after it hits. That creates a feedback loop between public disclosure and market reaction that speeds up the exact reputational and churn dynamics described earlier in this piece.
Put the whole picture together, and a single privacy incident can trigger immediate forensic and remediation costs, a churn tail that runs for years, a regulatory fine sized against global revenue, a litigation bill that keeps climbing, and an immediate hit to market capitalization, all running at the same time, not in sequence. Fines don't replace any of that. They extend how long the incident keeps draining revenue and management attention simultaneously, which is exactly why pricing a breach off the headline average number was never going to be enough.